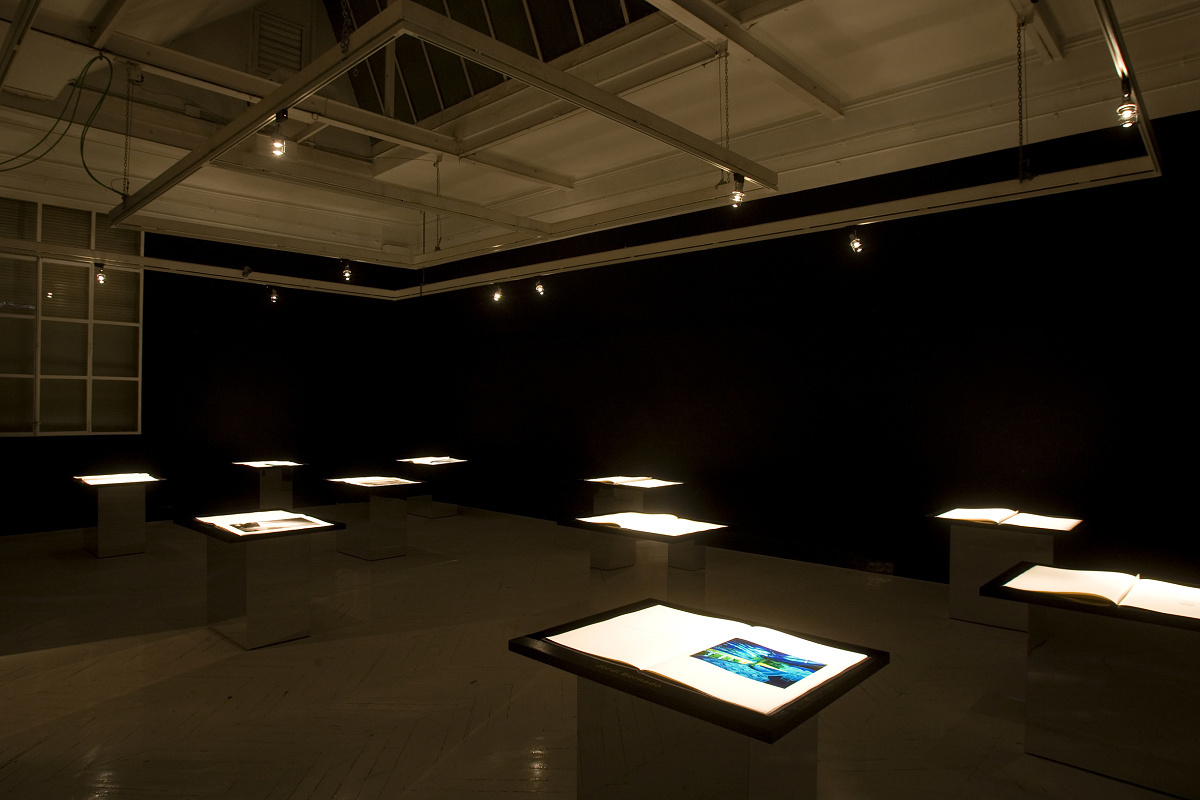
Sala Vinçon, "L´art de la Ilum" Exhibition, Barcelona
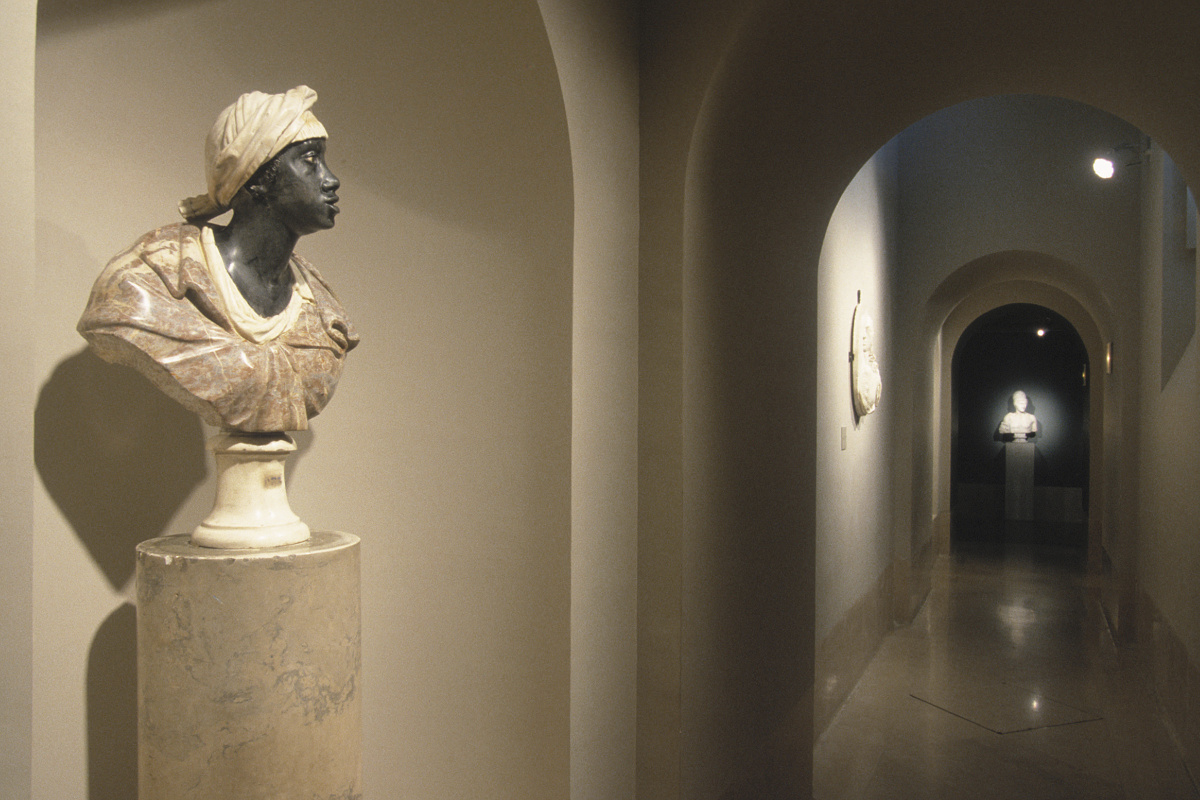
Museo del Prado, Madrid

Vigeland Museum, Norway
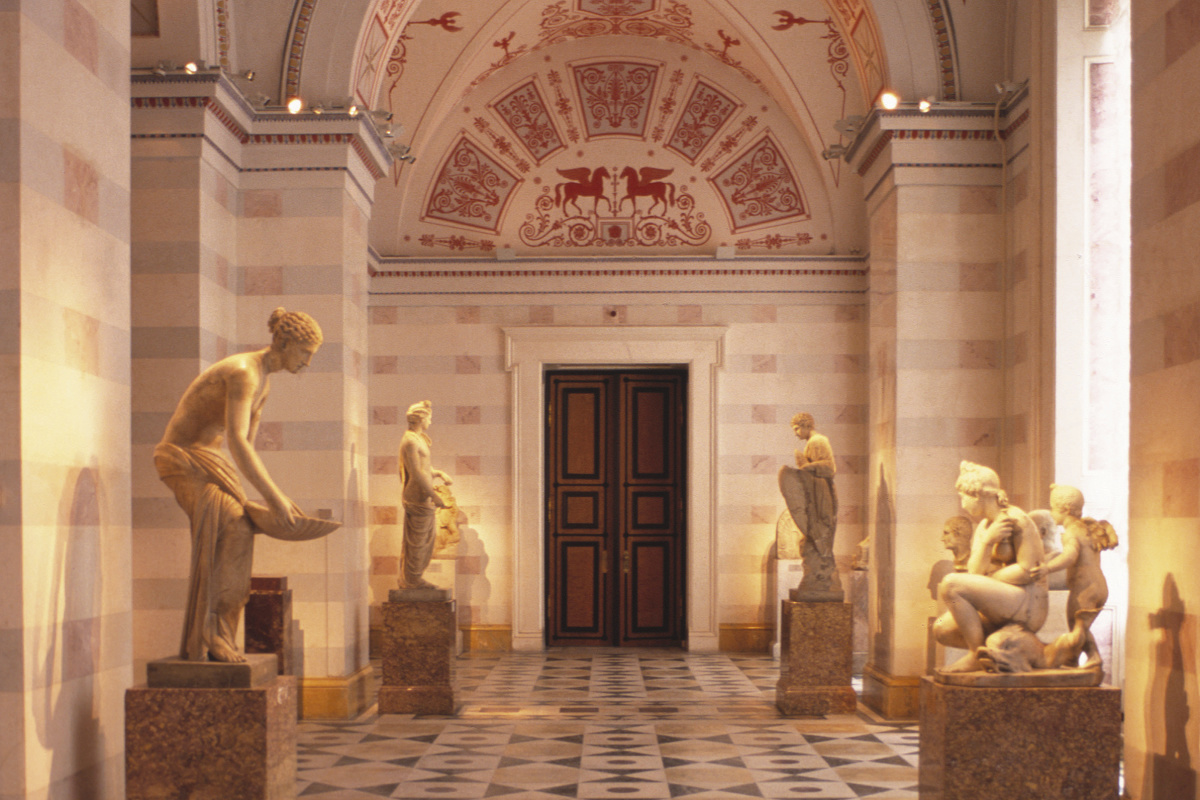
Hermitage, St. Petersburg
The light intensity distribution curve is obtained by taking a section through the light intensity distribution, which represents the light intensity of a light source for all solid angles. With rotationally symmetrical light sources, the luminous intensity distribution can be shown by a single light intensity distribution curve, whereas two or more curves are required for axially symmetrical light sources. The light intensity distribution curve is generally expressed in the form of a polar coordinate diagram, but with projectors it is often shown in Cartesian coordinates.


Narrow-beam spotlights accentuate the object and make it stand out against the surroundings. The beam of light is stretched into an oval using a sculpture lens. Flood lenses spread out the narrow beam and create a soft brightness gradient.
The narrower the beam of light cast on the object, the stronger the effect. Sculpture lenses are particularly suitable for projecting light at objects over their entire height. With their wide light beam, flood lenses illuminate the surroundings stronger and represent the object in its spatial relationship.
Sala Vinçon, "L´art de la Ilum" Exhibition, Barcelona
Museo del Prado, Madrid
Vigeland Museum, Norway
Hermitage, St. Petersburg